


Detailed live data
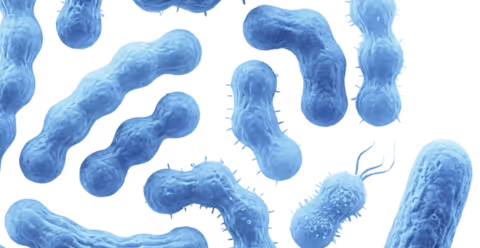
Partner E.coli data
E.coli monitoring site is located 320ft away.
Water samples are collected manually and analyzed using the
The data is provided by cmc.vims.edu
Monitoring site id: Anacostia River 5.
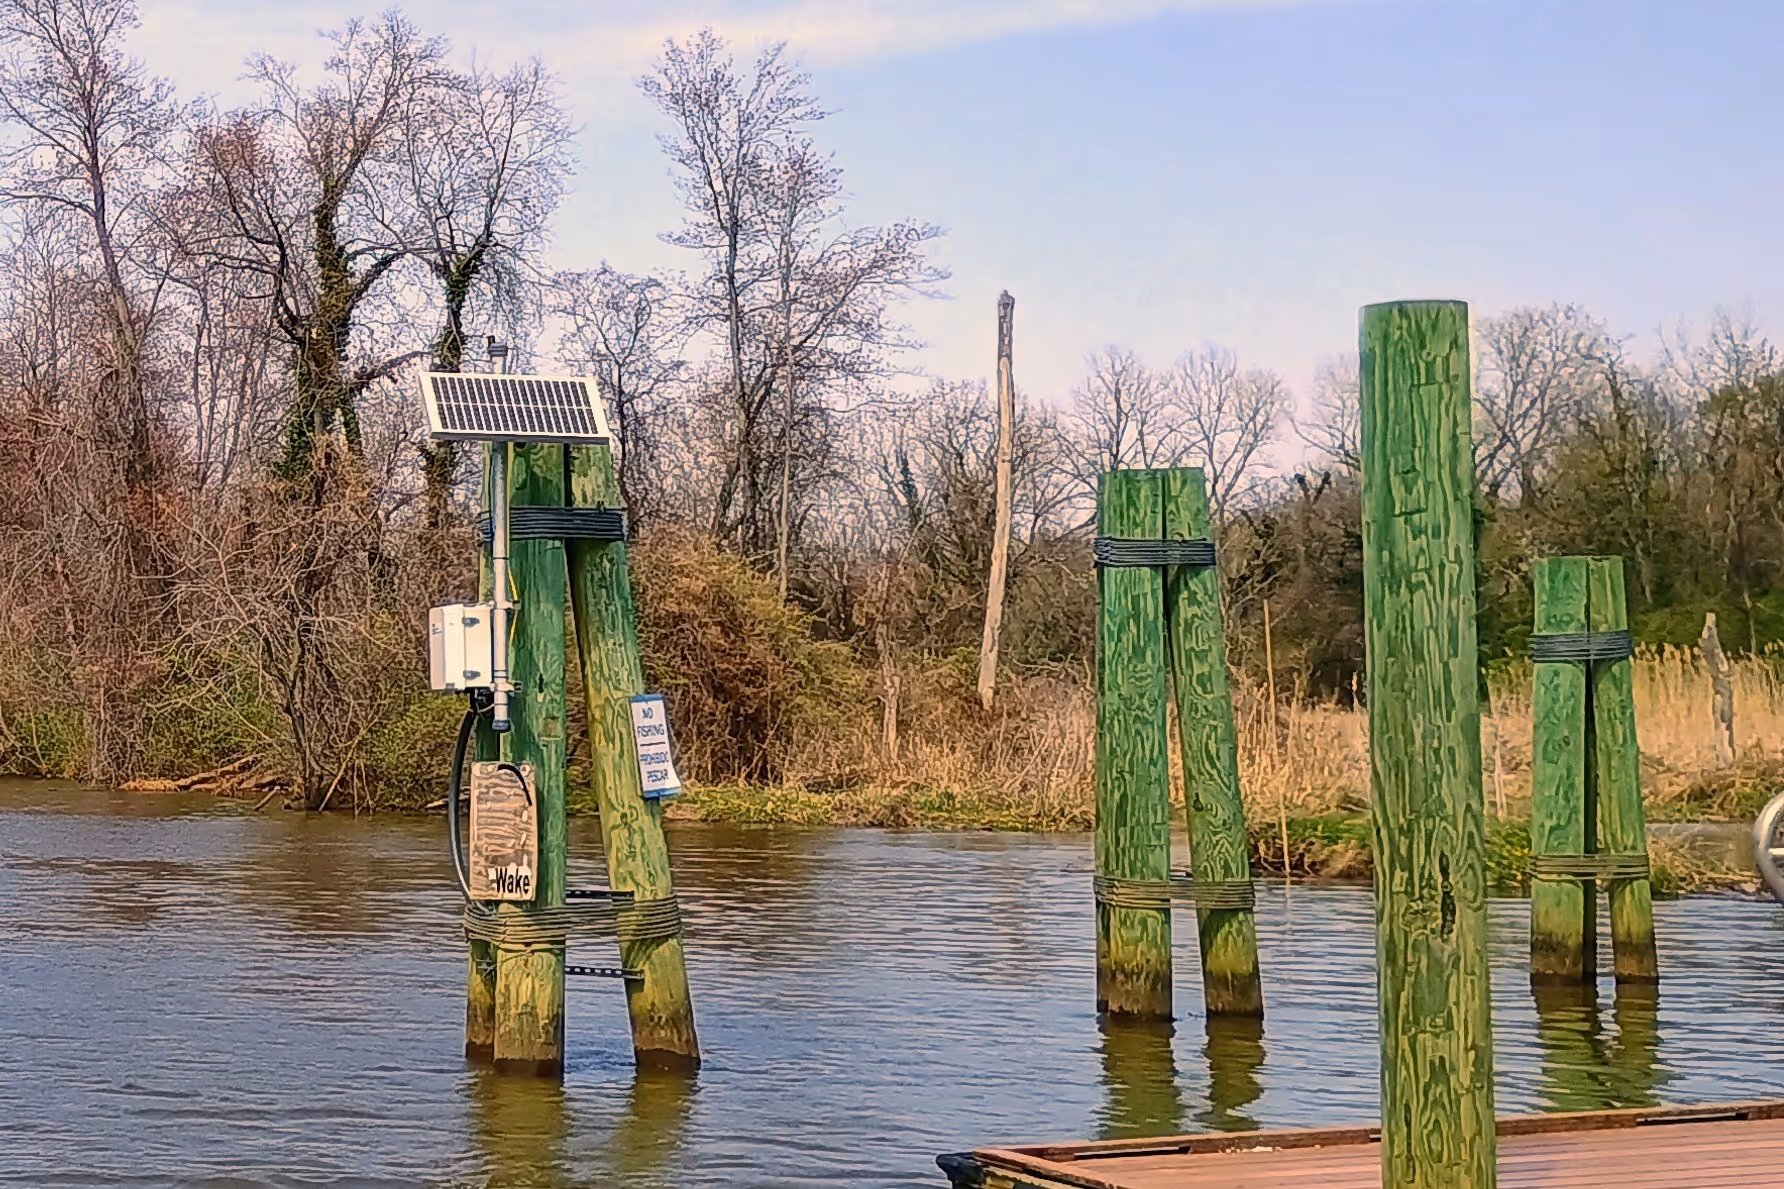
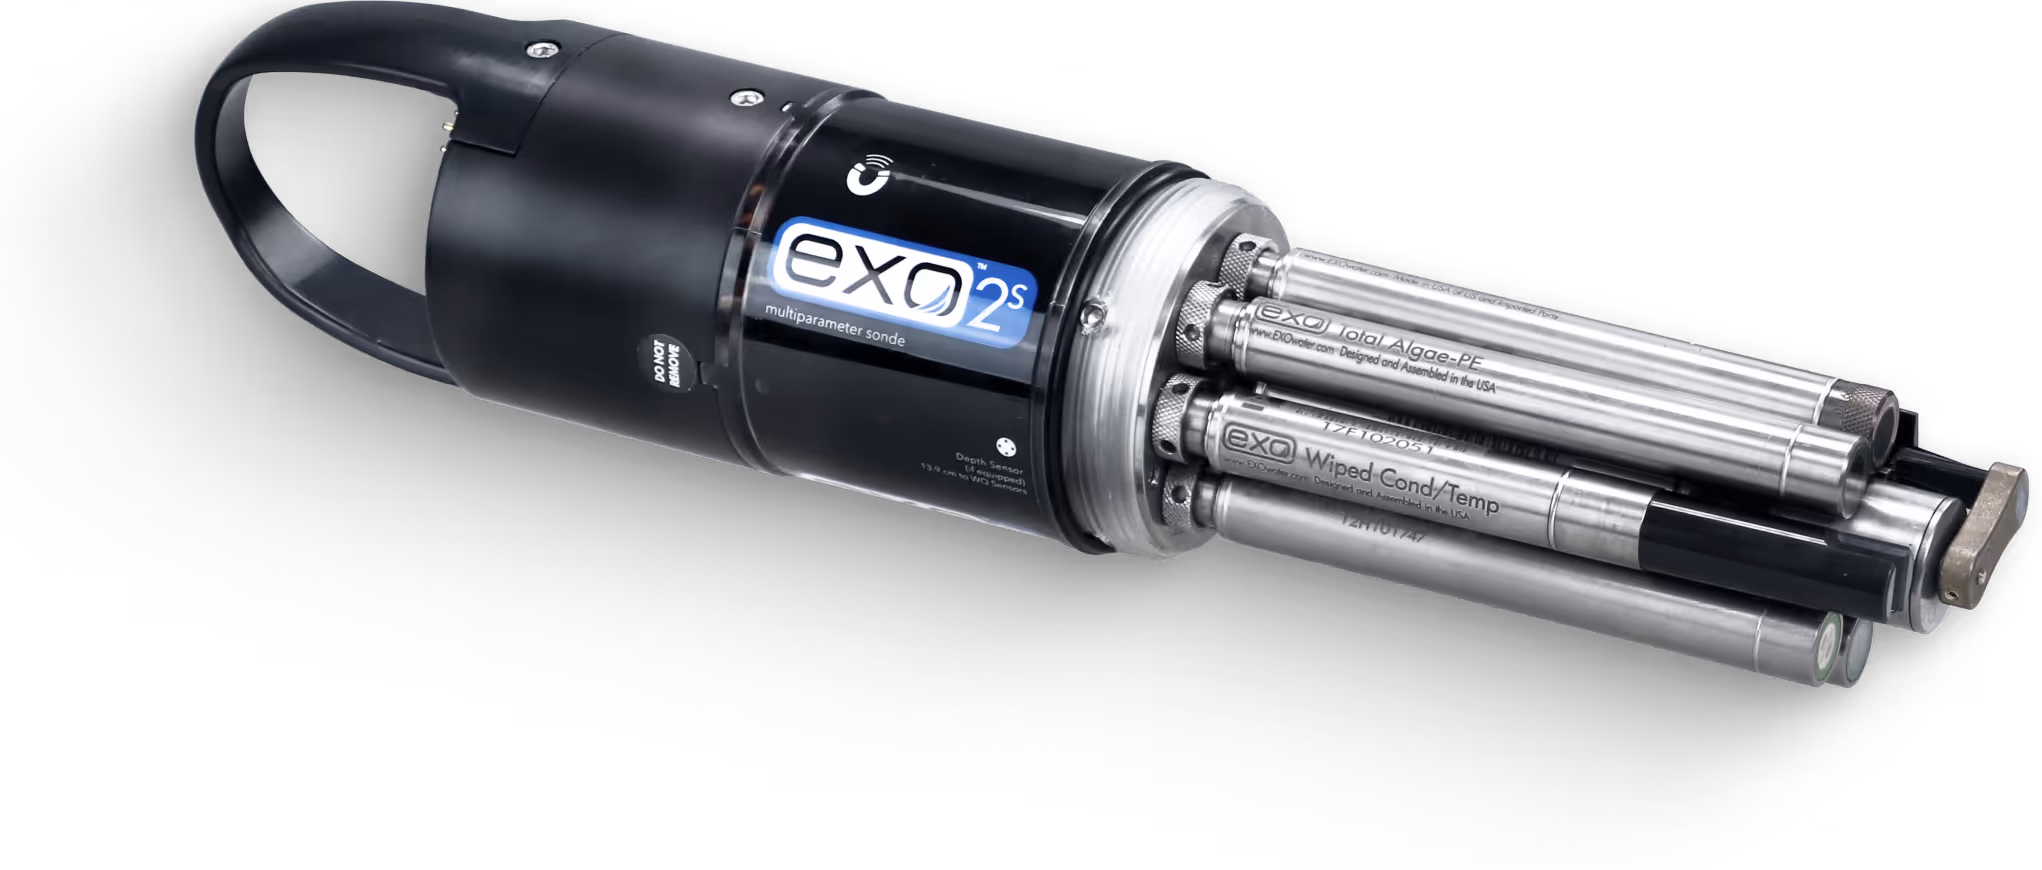
The hardware
Partner organization

Anacostia Watershed Society
The Anacostia Watershed Society was founded in 1989 by a small group of concerned individuals who decided that the environmental needs of the Anacostia River and its watershed communities required serious attention. Over the past 20 years, their staff and programming efforts have expanded significantly to encompass efforts in environmental education, stewardship, and recreation, as well as engaging the community through public affairs.

Faq
Questions
In designing the online data platform, we developed a process that would perform quality control (QC) tests to ensure the reliability of data collected by the EXO2S water quality sondes. All incoming sensor data are evaluated using industry‑standard Quality Assurance of Real‑Time Oceanographic Data (QARTOD) methods, which apply multiple, complementary checks to identify potential sensor errors, communication issues, or implausible environmental values.
When you see that a sensor is purple and has an unusual reading label it is because the data has failed one of these quality control tests.
The E.coli data for this site comes from the Chesapeake Monitoring Cooperative. They provide technical, programmatic, and outreach support to integrate volunteer-based water quality and benthic macroinvertebrate monitoring data into the Chesapeake Bay Program partnership and State agency regulatory decision-making processes. Data are stored in the CMC Data Explorer, which is publicly available and contains metadata information such as tiers/levels, problem and qualifier codes that can help inform its use.
Water samples for E.Coli testing are taken weekly by most of our partners. The sampling period runs May through September.
When looking at the daily or 7-day trends you may notice a place where data is missing. This is generally because the sensor was offline during that time period for routine cleaning or maintenance. Some of the equipment is also taken offline during the winter months to ensure it is not damaged by ice or winter storms.
This project utilizes the YSI EXO2s sonde to measure multiple water quality parameters at each location. The sondes are either inside a buoy or mounted to a dock. The EXO platform is designed for real-time and autonomous monitoring with minimal maintenance needed. Each monitoring station is powered by a solar panel. Data is logged onboard and transmitted via a cellular network to the cloud-based platform, Hydrosphere, where we pull the data to create our online dashboard. Data readings occur every 15 minutes.
To ensure accurate readings, the sensors are calibrated at regular intervals by local watershed protection organizations. Our dashboard utilizes a test for each data point to create alerts for readings that could indicate an issue with the sensors or a pollution event that has caused a specific parameter to spike outside of expected values.
The ranking system was created to indicate when water quality is adequate for sustaining the local aquatic ecosystem and to help community members make responsible decisions about recreation on the rivers.
Green – conditions are favorable and recreation is advisable
Red – unexpected values, water quality could be impaired
Purple – unusual data – sensor may require maintenance
Offline – this parameter/sensor is offline for the season or for maintenance
The data download feature allows anyone interested in exploring river dynamics and the health of DC’s waterways to use our data for their research. The downloaded data represents raw data that has been spike tested for outliners indicating an equipment issue but has not been cleaned by a human.
- Water Quality Monitoring Training
- Volunteer for local environmental organizations
- Learn about local waterways and water quality issues
- Events - Interstate for the Potomac River Basin
- Issues - Chesapeake Bay Program
It is up to each of us to help maintain healthy waterways.
If there is a 311 system in your region call them first to report
If you notice what looks like a pollution spill into a local waterway try to collect the following information then call US Coast Guard National Response Center at 800-424-8802 or the appropriate state agency (information below), then Call ICPRB at 773-913-8462.
- Location of spill, including:
- Name of affected stream/waterway
- Street address and/or latitude & longitude
- Identity of spill material
- Date and time of release
- Estimated quantity of material spill: total mass or volume or discharge rate.
Regional Organizations to report to - How to Report a Spill or Environmental Problem - ICPRB